
21 August 2026
How Can Moodle Help L&D Teams Demonstrate the ROI of Learning?
L&D budgets are under greater scrutiny than ever before. Senior leadership teams have generally become more sophisticated in the way they view employee training programmes in recent years. In the same period, an uncertain economic climate has led many organisations to tighten their belts. The result has been a 10% drop in L&D spending.

Senior leaders have big questions about L&D:
- ✳️ Are employees engaging with learning?
- ✳️ Are training programmes delivering results?
- ✳️ Where are the skills gaps in our organisation?
- ✳️ Are mandatory compliance training requirements being met?
- ✳️ What ROI are we getting from our investment in learning?
These big questions need to be met with equally big answers. But if you’re not proactively measuring the impact of your training programme, those conversations become very difficult. The best-case scenario is a disruptive, time-consuming scramble to find relevant data and analyse it manually. The worst-case scenario is that it’s impossible to conjure up an answer.
You can’t demonstrate the value of learning if you can’t see what is happening. Yet many L&D teams are caught on the back foot when asked to prove learning and development ROI. It doesn’t have to be like that.
Moodle Workplace can help L&D teams gain greater visibility of organisation-wide learning activity. Its automated reporting and visual dashboards reduce manual reporting and make learning data easier to understand and communicate to key decision-makers.
Why LMS reporting matters for demonstrating ROI
A powerful enterprise LMS, like Moodle Workplace, is always collecting data on every aspect of an L&D programme. As such, learning management system reporting is the obvious starting point for measuring and demonstrating ROI.
It’s not quite so straightforward for all organisations. Many L&D teams are still reliant on manual, spreadsheet-based reporting to track their programmes. Others are stuck with limited LMS reporting from a learning platform that’s not really equipped to answer the big questions we’ve mentioned above. L&D teams at large, multinational or growing organisations might even have the data they need scattered across multiple learning platforms.
Even L&D teams working with a powerful platform can face LMS reporting challenges. For example, there can be a temptation to rely on completion statistics. This risks reducing L&D to a box-ticking exercise. To truly demonstrate value, L&D reporting has to move beyond simply tracking activity to generating meaningful insight.
Without making this pivot, it becomes harder to identify trends, which in turn makes it harder to prove L&D ROI over time. Similarly, if you’re not drilling down into LMS reports to establish trends and insights, you’re likely to generate reports that are too detailed for senior stakeholders. An avalanche of statistics without the relevant context is likely to be as compelling to leadership teams as no reporting at all.
Striking the balance and achieving effective LMS reporting means generating:
- ✅ Actionable insights that can be presented to senior leadership
- ✅ A strong evidence base for L&D performance
- ✅ Quantifiable justification for past and future investment decisions

What LMS reporting metrics should L&D teams be measuring?
We’ve looked in general terms at what LMS ROI looks like. Now, it’s time to consider some of the key metrics that underpin L&D reporting. They include:
✳️ Learner engagement – How frequently learners interact with learning content and activities.
✳️ Course participation – How many learners enrol in or take part in specific courses.
✳️ Completion rates – The percentage of enrolled learners who successfully finish a course.
✳️ Assessment results – How learners perform in tests, quizzes and other assessments.
✳️ Progress – How far learners have moved through a course or learning pathway.
✳️ Mandatory and compliance training rates – The percentage of learners in a team or the organisation as a whole that have completed required training.
✳️ Performance across teams, departments or regions – How learning activity and outcomes compare across different groups within the organisation.
✳️ Trends over time – How learning activity, participation and outcomes have changed in response to changes, improvements or emerging issues.
Keep in mind that these are the starting points for demonstrating L&D ROI. These metrics alone don’t give the depth needed to present a compelling case to senior leaders.
L&D ROI will ultimately depend on how these metrics dovetail with wider organisational goals. ‘Number of courses completed’ and other top-level statistics don’t prove ROI in isolation.
How Moodle Workplace can improve L&D reporting
Once those key L&D reporting metrics are defined and an understanding of how insights will help to prove L&D ROI is established, your attention can shift to making reporting as efficient, effective and useful as possible.
This is where Moodle Workplace can elevate your L&D reporting processes, streamlining admin for your L&D team and generating meaningful insights for senior management. There are several key ways in which it achieves this:
Accessing learning data more efficiently
At the most fundamental level, it becomes easier and more efficient to access key learning data, reducing the time needed to find and interpret data.
A powerful enterprise LMS like Moodle Workplace collates all of your learning data and provides the tools you need to access, search and filter this wealth of information to pinpoint the insights that matter to you. This enables you to quickly access data that might otherwise involve a laborious and time-consuming process, and do so with a lower risk of human error becoming a factor.
Visualising key learning metrics
Get instant, at-a-glance insights into how individuals, teams, divisions and the organisation as a whole are performing against key L&D reporting metrics.
Moodle Workplace’s visual learning dashboards bring your LMS reporting data to life, making it easier to absorb key information and to spot data points that need further investigation.
Engaging senior managers with visual reporting
Visual dashboards also make it easy to present key insights in a way that is easily digestible by senior management. We discussed earlier how lengthy, data-heavy reporting can be counterproductive when trying to convey L&D value to stakeholders.
With Moodle Workplace, your L&D reporting presents information in a more accessible format. This encourages stakeholders to engage with the most valuable insights, helps the information to sink in and provides evidence to support more credible conversations about ROI without unnecessarily inconveniencing managers.
Saving time by automating recurring reports
Once you have a clear idea of the insights that matter to senior leaders – and that help demonstrate the value of your L&D programme – you can automate report creation and their delivery to the relevant stakeholders.
Keeping senior leaders informed doesn’t take any additional time. Create the report once in Moodle Workplace, then schedule it to run and be sent to management as frequently as is appropriate.
Cutting out manual report creation
Whether it’s recurring reports like we discussed above, preparing for an audit or responding to an ad hoc query from senior management, there is no need to waste time trawling through spreadsheets or compiling reports manually.
With the Moodle Workplace report builder, you can quickly home in on the data that’s relevant to the audit or query in question. The report can be created very quickly, and duplicated, edited or reused whenever needed. The result is a huge saving of L&D time and resources in comparison to manual report creation.
When thinking about learning and development ROI in general and LMS ROI in particular, don’t forget these administrative savings are themselves an important part of understanding the value delivered by an LMS
Monitoring learner engagement and progress
All of the improvements we’ve mentioned in relation to accessing learning, visualising data and generating reports also make it easy to monitor how learners are engaging with your learning and how they are progressing over time. Both of these factors are important for understanding learning performance and building the evidence needed to assess L&D ROI.
Since it’s quicker and easier to track learning, it also becomes simpler to make early interventions to resolve issues. This could be low compliance rates in a particular team, an emerging skills gap or a course with poor engagement. These insights form the basis for action that ultimately improves the return on investment from L&D.
Segmenting data across different organisational groups
For large, multinational and growing organisations, where L&D is delivered across multiple divisions or business units, L&D reporting needs to deliver a clear analysis of what is happening within each organisational group, as well as across the organisation as a whole.
Moodle Workplace reports make this type of segmentation simple to achieve. Getting detailed insights for one business unit, a specific aspect of L&D across multiple units, or high-level overviews across the organisation is as straightforward as building reports in the way we’ve already discussed.
Turning LMS data into board-level conversations
With Moodle Workplace freeing up considerable L&D time and resources through automations and streamlined reporting processes, your admin workload becomes lighter. This creates the capacity to take a final, crucial step in this process: turning LMS reporting data into outcome-focused conversations with senior management.
An impressive headline statistic should no longer be the extent of the insights you offer to key stakeholders. They will be able to see those key figures at a glance courtesy of Moodle Workplace’s learning dashboards.
Instead, you must take responsibility for joining the dots between the data and wider business and strategic goals. In doing so, you move the conversation away from basic reporting activity towards discussing performance, trends and opportunities. These are all areas in which L&D ROI comes to the fore.
What this looks like in practice will depend on your organisation, your data and your objectives. Here are some general examples of how to turn raw LMS data into insights that are helpful to decision-makers.
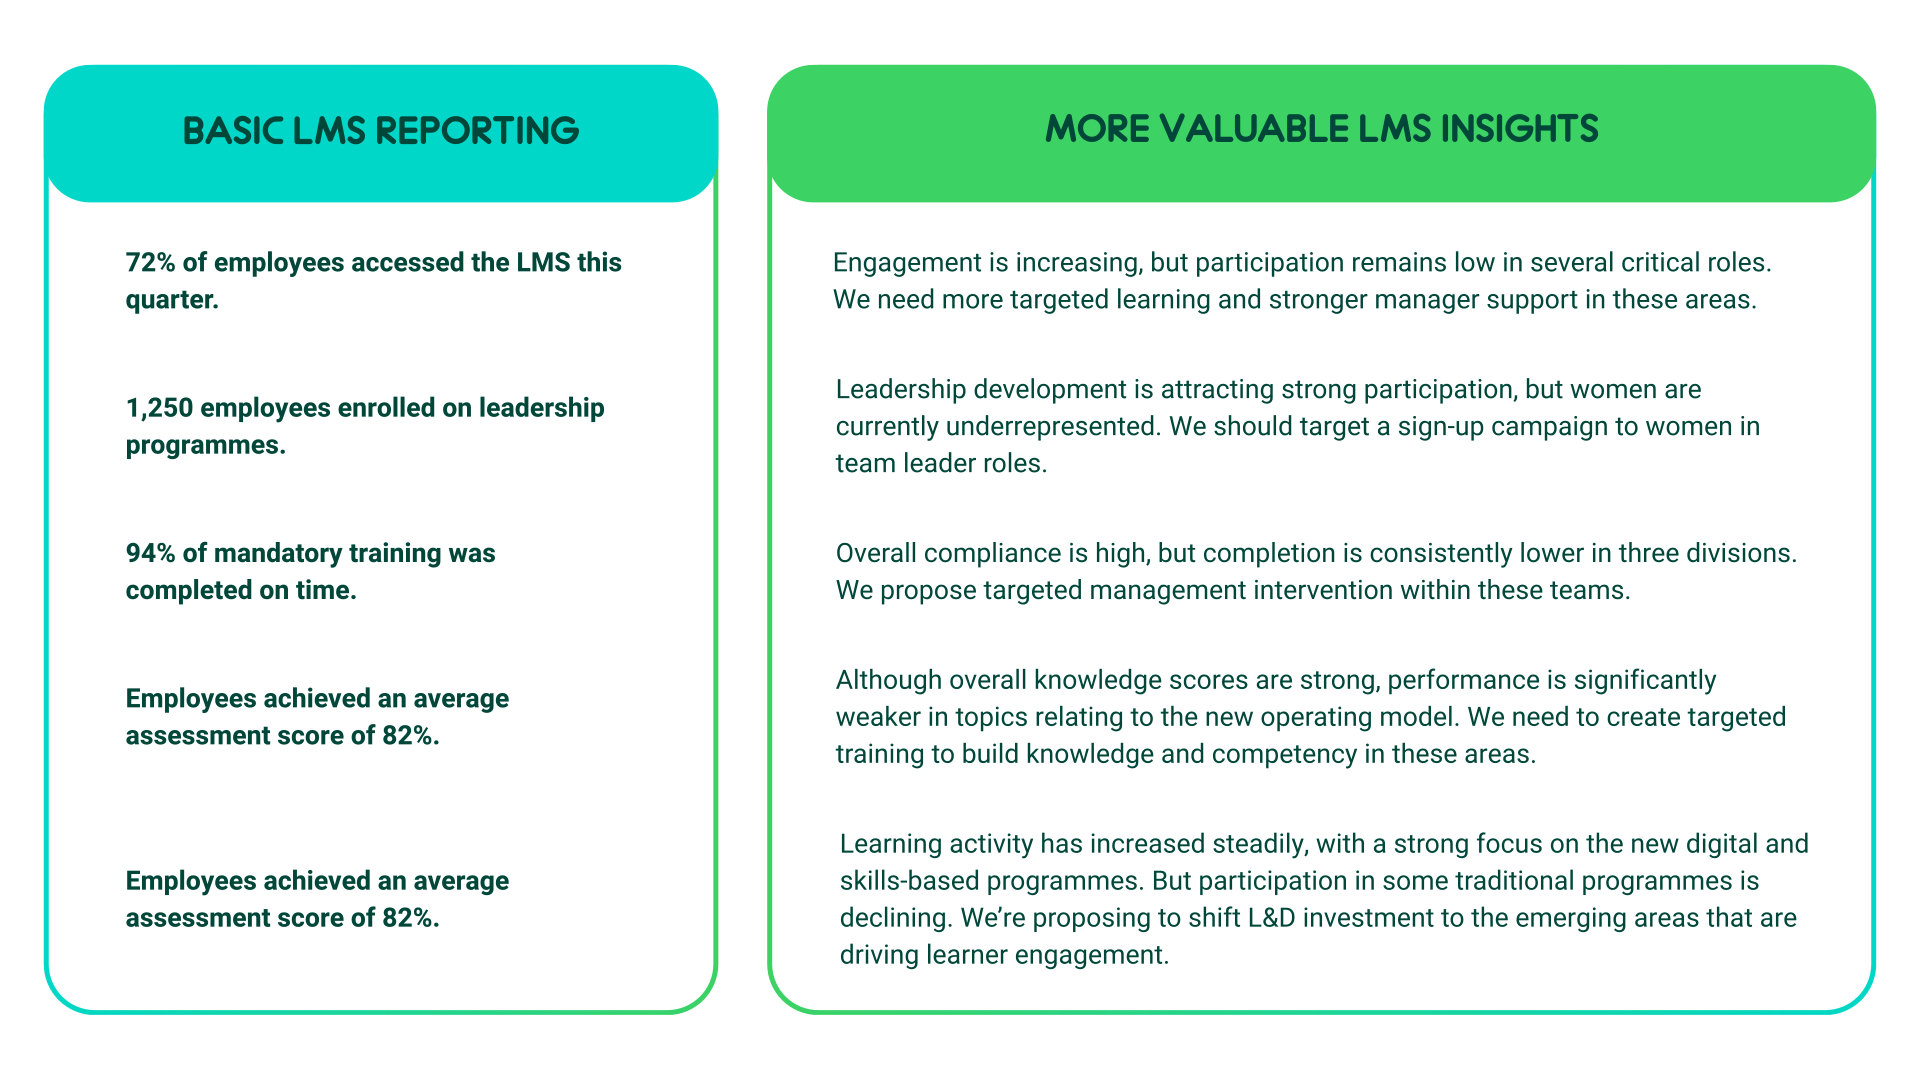
Choosing an LMS to drive and measure ROI
If LMS ROI matters to your L&D team and the wider organisation, you need a learning platform that supports those priorities. Key features and functionality to check for include:
- ✅ Automated LMS reports – Can reporting be automated and, if not, how much work needs to go into creating regular reports manually?
- ✅ Customisable dashboards – Can dashboards be customised to meet the needs of different audiences, including L&D teams, managers and senior leaders?
- ✅ LMS data segmentation – Can data be segmented to create valuable insights for individual teams, locations or learner groups?
- ✅ L&D engagement tracking – Can the LMS track learner engagement as well as course completion?
- ✅ Visual reporting – Are reports presented in a format that will be easily understood by non-L&D stakeholders?
- ✅ Scalable LMS – Will the LMS and its reporting functionality scale if the organisation grows or its business units change over time?
- ✅ Trend analysis – Can you easily compare learning activity and outcomes across different months, quarters and years?
- ✅ LMS integrations – Will the LMS integrate with HRIS and other key business systems to connect learning data with business outcomes?
As we’ve seen above, Moodle Workplace does include all of these features, plus many others. This not only saves time and resources, but also makes it easier to analyse, understand and communicate key insights about learning activity and the wider impact on the ROI of learning and development.
Start building meaningful L&D ROI insights
You can only share the sort of actionable L&D insights we’ve looked at in this article by first improving your learning performance visibility. Demonstrating ROI starts with tracking, measuring and analysing the metrics that matter to your organisation.
Moodle Workplace gives L&D teams a better reporting infrastructure to understand learning activity, identify trends and communicate actionable insights to senior stakeholders.
See how Moodle Workplace would work for you by joining a free demo to explore the platform with Synergy Learning. We’re experienced Moodle partners, having worked with the platform daily since 2005. We will guide you through every aspect of how Moodle Workplace can help you deliver and demonstrate value from your learning.